Joules or Watts?
Power and energy efficiency concerns dominate much of modern civilization, including computing. However, we often get them confused, which can lead to incorrect conclusions. I keep them straight with a simple analogy:energy : power :: distance : speed
Energy, measured in Joules, is fundamental. Power, measured in Watts, is a rate: energy per unit time. This is just the same relationship as distance and speed. Let's talk about distance and speed for a moment to make sure we've got the right set of intuitions at hand.
A Short Detour
Imagine you're driving around town. Your speed varies with time - from 0 m/s when you're stopped at a stoplight, up to somewhere around 30 m/s when you're on the freeway. We could graph your speed as a function of time, and get something like this graph of the EPA's high speed freeway test cycle:

If I asked you what the average speed is over the entire time period of this test, you could compute it by taking the distance traveled and dividing by the time of the test. In this case, it's about 21.6 m/s. However, there are intervals in the test where the average speed is significantly higher: in the middle of the test, the car travels for at least 100 seconds at a speed of over 30 m/s. And at the end, when the car has to stop at a series of stoplights, the average speed is probably more like 10 m/s. The question of average speed depends significantly on the period of time you choose to measure over.
Joules and Watts
Recently, AnandTech and TechReport, two of my favorite tech review websites, have been publishing power graphs for CPUs that are very similar to the speed graph we just looked at. They hook up a watt meter to a processor, ask it to perform a task, like booting an operating system, or rendering a 3d image, and then show power consumption versus time. I've really enjoyed these power graphs, they contain tons of information and do a great job comparing power and energy efficiency.However, both of them have been reporting summaries of these power graphs in ways that I consider incorrect: confusing power and energy in ways that can lead to incorrect conclusions.
AnandTech has been reporting "average watts" over the test period, which is similar to "average speed" over the EPA highway cycle. TechReport has been reporting "total energy over test period", which is similar to "total distance". Both of these metrics are confused, because they are dependent on the choice of test period, just like average speed depends on choice of test period with our highway test cycle example.
Not only are the metrics they report dependent on the choice of test period, but the choice of test period they use is arbitrary: it is typically chosen so that the test period is a little longer than the time needed for the slowest CPU in the comparison to finish the task. This is very strange: the number they report for processor A depends on the particular processor B they were comparing against on that particular day. If they needed to compare against a different processor C, it's possible the number they report would be completely different. This makes it impossible to compare the numbers they report, either across different tests made by the same website, or across websites. Additionally, this can lead to incorrect conclusions.
In Theory
To see how strongly these metrics depend on test period, let's look at a simple analytic model for power consumption of a computer performing a task.A Simple Power Model

\begin{equation}
P(t) = p_i + p_a(u(x) - u(x-t_0))
\end{equation}
The processor consumes $p_a + p_i$ Watts until the task is complete, and then $p_i$ Watts after that throughout the remainder of the test period.
\begin{equation}
E(t) = \int_{0}^{t}P(x)dx = \int_{0}^{t}(p_i+p_a (u(x)-u(x-t_0)))dx
\end{equation}
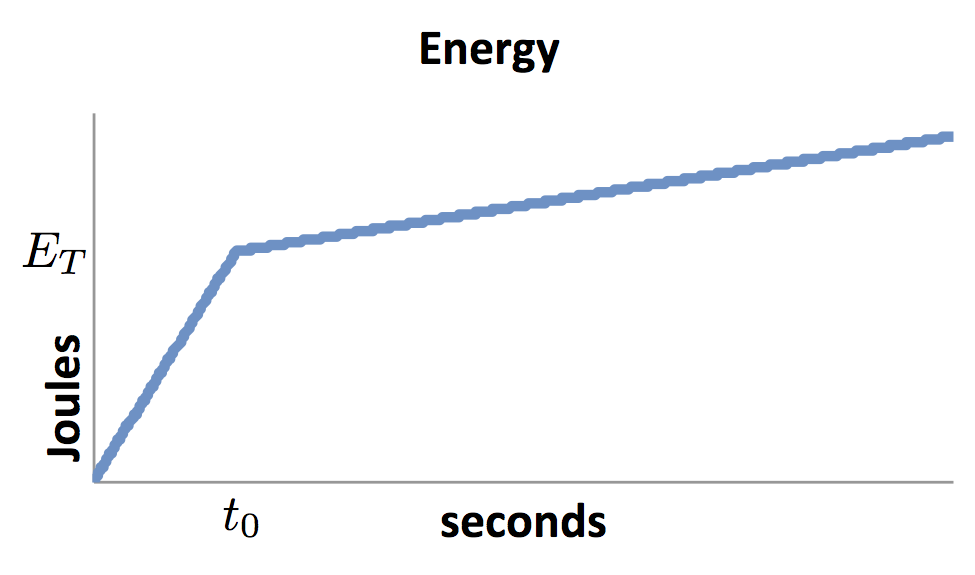
The amount of energy consumed by the processor grows quickly and steadily with time until the task is complete, at which point it grows slowly and steadily as the processor idles. Let's call the total amount of energy consumed by the processor in order to perform the task $E_T$. This amount of energy is the correct metric for discussing the energy efficiency of a processor performing a task. Note that $E_T$ doesn't depend on the test period, but the total energy continues to increase for as long as the test runs.

Computing average power is analogous to computing average speed, where we took the distance traveled after some amount of time, and then divided by the amount of time.
\begin{equation}
\overline{P}(t) = \frac{E(t)}{t} = p_i + p_a (u(x) - u(x-t_0)) + \frac{p_a t_0 u(t-t_0)}{t}
\end{equation}
With this model, the average power $\overline{P}(t)$ is constant at $p_a + p_i$ watts until the task finishes. Afterwards, it falls off at $\frac{1}{t}$, asymptotically falling towards $p_i$ watts.
If you were going to pick a single "average power" number to report as a metric, what would be the correct number? As you can see, the result depends strongly on the test period you measure.
In Practice
I'm going to pick on AnandTech in this section, only because they usually do such a good job technically. In this article, AnandTech gives some great data on mobile SoC power, but they report Average Power incorrectly. To illustrate this, I took the "cold boot - CPU power only" graph from their article, and digitized their data for the Intel CPU.

As you can see, the processor works for some period of time to boot the operating system, after which it drops down to idle. As before, we'll call the time needed to finish the task $t_0$, and the idle power $p_i$.


As you can see, the processor works for some period of time to boot the operating system, after which it drops down to idle. As before, we'll call the time needed to finish the task $t_0$, and the idle power $p_i$.

We can then integrate to find the energy dissipated by the processor. This graph is similar to our analytic model: the total dissipated energy rises at some faster rate until the task is complete, and then at a much slower rate after the processor falls back to idle. On the graph, I've marked $t_0$ as well as $E_T$, the energy needed to complete the task.

Finally, let's look at the average power as a function of time. After $t_0$, the processor falls to idle, and we see the same $\frac{1}{t}$ falloff that we saw with our analytic model. AnandTech reported that the "average power" for this CPU was 0.48 W, but as you can see in the graph, that describes only the average power at the end of the test period, and the length of the test period was not determined by this CPU, but by the other CPU that was being tested in the article. Had they chosen a different test period, they could have reported anywhere from 0.7 W (the value at $t_0$) to 0.1 W ($p_i$). As the time period lengthens, the reported result trends back towards $p_i$, regardless of what the active power while performing the task actually was.
A Plea
The correct way of measuring energy efficiency for a processor completing a discrete task is to report Joules. $E_T$, the amount of energy needed to perform the task, does not depend on the time interval used for measurement. I believe the reason TechReport and AnandTech have been reporting $E(t)$ or $\overline{P}(t)$ for arbitrary $t$ is that they want to quantify benefits resulting from lower idle power $p_i$. Because these metrics become dominated by $p_i$ as $t$ increases, using these metrics gets you a combined rating of both active and idle power. The problem is that the combination of these two is done arbitrarily and unsystematically.
Since these sites have already measured $p_i$ separately and reported it (for which I am grateful), we don't need $p_i$ mixed into our active power measurements anyway! Instead, if they would just report $E_T$, we would have a sound, reproducible and comparable metric that could be clearly understood.
Since these sites have already measured $p_i$ separately and reported it (for which I am grateful), we don't need $p_i$ mixed into our active power measurements anyway! Instead, if they would just report $E_T$, we would have a sound, reproducible and comparable metric that could be clearly understood.
It's important to draw a distinction between discrete workloads and non-discrete workloads. For non-discrete workloads, like rendering a video, or playing a game, reporting average power is the correct metric. But for discrete workloads, like booting an operating system, energy is the correct metric, not power. I hope that in the future, these sites will consider reporting $E_T$ rather than $\overline{P}(t)$ or $E(t)$ at some arbitrary $t$. If they did so, we would be able to have a more scientific, well informed discussion of energy and power efficiency, which I think is critical to our broader understanding of these important issues.
No comments:
Post a Comment